PERFORMANCE
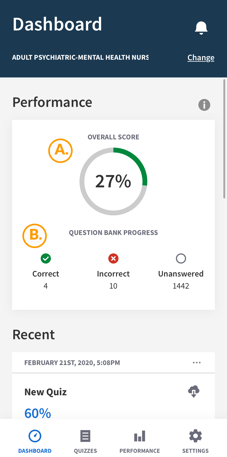
Upon logging into your BoardVitals account, you will be greeted with the Performance overview on your Dashboard. The performance data on the dashboard is calculated from completed Timed and Untimed tests. Here’s how to navigate your Performance:
A. Overall Score - This percentage shows you how many questions you’ve answered correctly out of the number attempted.
B. Question Bank Progress
Correct - How many answers you’ve answered correctly.
Incorrect - How many answers you’ve answered incorrectly.
Unanswered - How many questions you have yet to answer in your question bank.
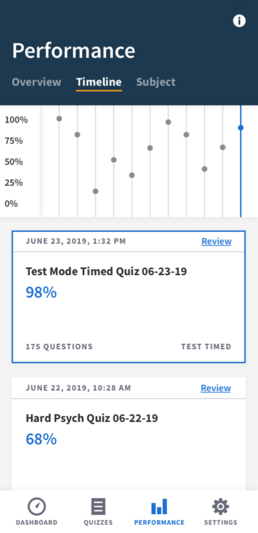
You can also access your performance data by selecting the Performance tab on the bottom of your screen.
The Performance Tab allows you to view your progress as you study. Performance statistics are based only on quizzes taken in a Test Mode (Untimed, Timed, or for NCLEX users, CAT).
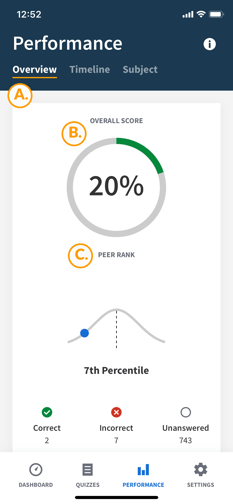
A. Overview: Provides you with a detailed review of your performance to date.
B. Overall Score: This percentage shows you how many questions you’ve answered correctly out of the number attempted.
C. Peer Rank: Our Peer Rank metric shows how you are ranking compared to your peers using the same question bank.
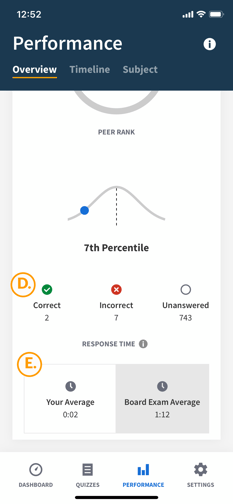
D. Answer Status: The count of how many Correct, Incorrect, Or Unanswered questions.
E. Response Time: Measures the average amount of time you took to answer each question. While your score is a measure of your accuracy, Response Time is an important add-on metric that indicates your fluency. By comparing your time to answer a question to the average time you will have on the exam on test day, you’ll know exactly how quickly you need to move to get through all the questions.
Timeline: Your competency changes as you study. See a visual representation of your performance over time or drill down to only examine a particular date range. Visibility of how you're progressing keeps you in control.
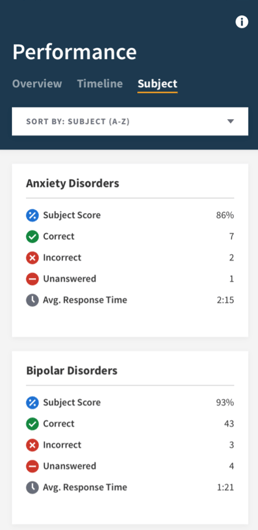
Subject: See how you’re doing in each subject you have begun answering questions from, with the ability to view your Overall score, Correct/Incorrect/Unanswered Questions, and Average Response Time. Filter A-Z, or by your highest or lowest scoring subject.